How to Read an Inflation Rate — % Change vs Price Level
An annual inflation rate usually describes the percentage change in a consumer-price index over a year. It is a rate of change in an index—not the price level itself, and not necessarily the change experienced by any one household.
Worked example · Updated
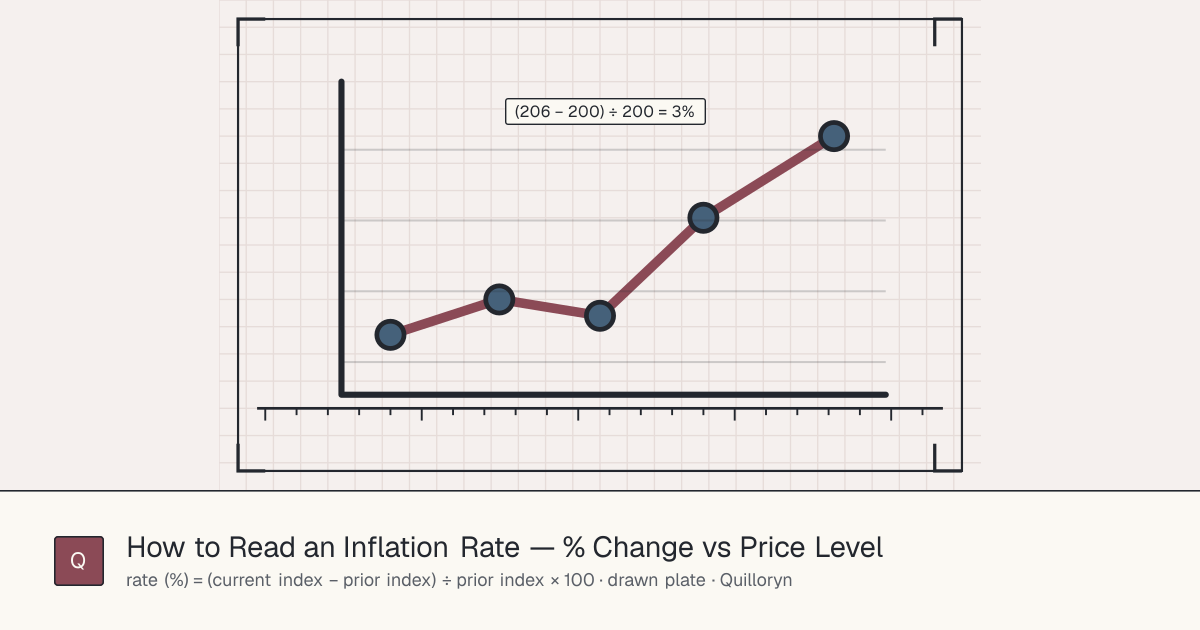
Read the period and measure
Check whether a published value is year-over-year, month-over-month, annual average or another measure. Two percentages can only be compared meaningfully when their definitions and periods match.
A positive annual rate generally means the measured price index is higher than in the comparison period. A lower positive rate can mean prices are still rising, but more slowly.
A simple index example
If an illustrative index moves from 200 to 206 over a year, the percentage change is (206 − 200) ÷ 200 × 100 = 3%. The 3% describes the index change over that period; it does not mean every item or household spending pattern increased by exactly 3%.
The index, reference period, collection methods and revisions matter. Always read those alongside the percentage.
Explore a selected indicator
The linked viewer opens the inflation measure for a selected economy. Choose another economy if needed and press Show to reveal the latest available observation and the historical values.
Public economic observations may be annual, released after the measured period and revised later. The most recent available year may not be the current year.
| Prior index | Current index | Change |
|---|---|---|
| 200 | 206 | 3% |
| 250 | 255 | 2% |
| 100 | 100 | 0% |
Continue exploring
Currency Reference Rates vs Dealing Rates: Why They Differ
Learn why a currency conversion can differ from a bank or card quote. Understand reference dates, rates, spreads, fees and a simple worked illustration.
Compound interest: formula, assumptions and worked example
Explore P(1 + r/n)^(nt) with a worked monthly-compounding example. Learn rate conventions and assumptions, then open the formula with values already filled in.